Tuesday, January 31, 2006
Marketz & Stockz : The Momo hangman cometh..
We are watching as goog crashes and burns in after-hours. Even after the anemic 5 o'clock bounce , almost 20 billion dollars of market cap wiped out and counting.... As readers of this blog know, I have been sounding warnings on the overheated momo stocks for a while now. Came very close to shorting GOOG on two occasions today (once at market open and another just after FOMC announcement) but lacked the nerve to follow through. Sucks. I take some consolation in owning some longer term SMH puts that should benefit from the carnage that google's earnings miss is going to subject the entire market to.
If you happen to be a google stock owner or owned google calls,etc, you have my sympathies. But gotta say the signs were there. The vicious sell-off on Friday, the 20th of Feb had GOOG at its epicenter..if you remember. Even though the media bamboozled the public into believing the sell-off was about google's tussle with the government, it was actually smart (informed) money bailing out in advance of the very event we are witnessing now.
Technorati Tags : Marketz Stockz GOOG SMH Stock-Market
Marketz : Inflection Point ?
Thursday, January 26, 2006
Sectorz & Stockz : BRCM, GOOG, DNA
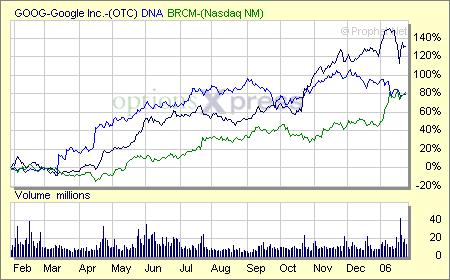
Just in case you havent heard, Broadcom (BRCM) reported a blowout quarter and raised revenue growth for the quarters ahead. Short covering of epic proportions, presumably by one or more hedgefunds resulted in the stock being driven up 24 % higher in after-hours trading.
And thats not all. A certain television personality has issued mom-back calls on both MRVL and BRCM. BRCM accounts for 3% of SMH and other chip design stocks are going to be bid higher as a result of the echo-effect- so expect SMH to be substantially higher in tomorrow's trading. Our hunch of strong buying in SMH by "well-informed money" aka smart money turned out to be correct. Thursday's trading action in SMH followed the script laid out in this previous post. But after-hours fireworks were surprising to be sure.
The chart above compares the run-up in the ultimate momo stocks in the last one year. After Thursday evening's post-earnings frenzy, BRCM's return will be almost the same as google's. The annihilation of shorts today and tomorrow means further gains will be muted in my humble opinion. Cant help feel looking at the chart above that all these three iconic stocks are at or near their zenith. Google reports early next week-so we shall find out.
Technorati Tags : Sectorz Intraday technical-analysis BRCM DNA GOOG SMH Stock-Market
Wednesday, January 25, 2006
Marketz : Those candlesticks again
Definitely worth checking out. In the markets, anticipation is half the battle. If you see it coming, you can take measures beforehand (ideally). But even if you don't take those defensive measures, the forewarning allows you to maintain a semblance of sanity in dealing with the event (another big black candlestick in this case)- should it actually transpire.
Technorati Tags : Marketz technical-analysis trendlines Stock-Market Trends three-methods candlesticks
Intraday & Sectorz : Watching the Semis
Semis (SMH) continue to be the scene of exciting market action. Its nice to have a sector that moves a percent on even sluggish days and several percent on a good one. As previously pointed out, SMH bore the brunt of last week's decline. Yesterday, the semis made a small black candle with a long upper shadow. Soon after the markets opened yesterday (Tue), several poeple had apparently decided that the all-clear on tech had been sounded. These people jumped headlong into the semis and drove the price up nearly 2 % to 38.10 within the first twenty minutes of trading in a bout of momentum based buying. I think the buyers showed too much enthusiasm and showed their hand. Then came the backlash that took the semis back to the low 37s resulting in the long upper shadow.
The market has a rather consistent way of punishing those late to the party. People who were buying the semis above 38 yesterday were clearly asking to be separated from their money. I mean-2 % in twenty minutes (even on the semis) is rather unsustainable and buying there is putting yourself on the wrong side of the risk-reward equation. If the semis recovered their gains too quickly, their atonement would not be complete with one caveat that I'm going to get back to. So we saw the semis being sold off for most of the day today, until they got really oversold around 36.83 and mounted a late rally to finish the day close to flat. It was also another high volume day for the SMH.
After hours, we got good earnings news from some key SMH constituents such as Novellus (NVLS), LSI Logic (LSI) and Altera (ALTR). This led the SMH higher in AH trading and is also likely to lead to a higher open tomorrow. It also possible, even likely that the smart money (money backed by information) started buying aggressively towards the close today beacuse they knew. If it was the same people buying yesterday at market open on good information, atonement for yesterday's momentum frenzy at the open may not be necessary and the SMH may zoom higher. We shall see.
I saw some clear technical damage done to the charts because of last week's action - especially on Friday. Others think differently. Fund manager John Hussman, whom I respect and listen to- was impressed with market internals in the face of last week's sell-off. Something to keep in mind.
Technorati Tags : Sectorz Intraday technical-analysis SMH Stock-Market
Monday, January 23, 2006
Intraday & Stockz : Higher volume on dips
Sorry, cant post more. Gotta watch and gotta trade. Will be back later in the evening.
Its ten minutes to 6, EST now and I have a little more time to post. This is one day where I am actually looking forward to hear what Mad Money's Jim Cramer has to say tonight. Friday, he did ask his viewers to lay-off tech till TXN's results were out. and said "The time to get aggressive on tech buys isn't now but when Texas Instruments disappoints" in his Real Money article.
Sunday, January 22, 2006
Marketz & Sectorz : Some pretty ugly charts
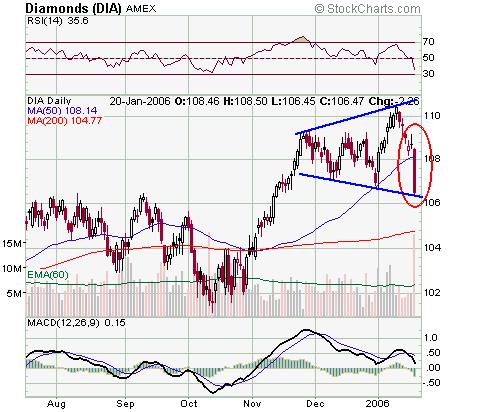
When one looks underneath the surface of the market at the charts of the various sector ETFs, the extent of the technical damage becomes apparent. These charts are painting a fairly grim intermediate-term picture.
Firstly the DOW. Unambiguous bearish Megaphone with an evening doji star pattern to boot in the last three trading sessions.
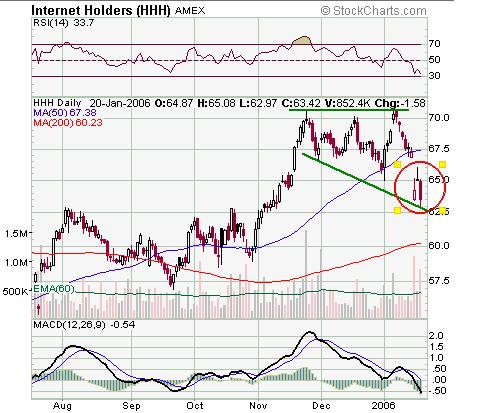
Bearish megaphone and an evening star (bearish) candlestick in the Internet Holders (HHH).
Bearish descending triangle in the retailers (RTH). Bearish evening doji star candlestick at the end.

Wedge pattern in the one year chart about to become megaphone in the industrials (XLI). Also bearish candlestick action in the last three trading sessions.

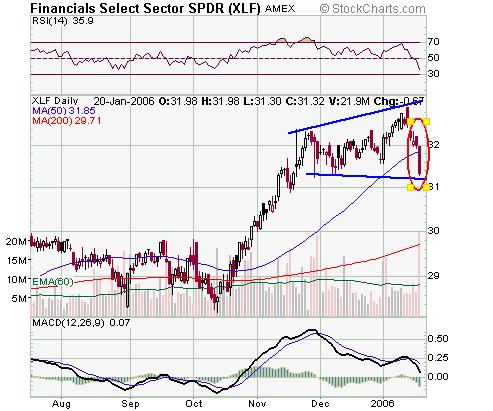
Bearish megaphone in the XLF after an uptrend signaling further downside. Confirmed bearish engulfing candlestick pattern in the financials.
Technorati Tags : Marketz Sectorz technical-analysis DIA HHH RTH XLF RTH XLI trendlines Stock-Market Trends evening-star candlesticks
Marketz : QQQQ & SPX charts
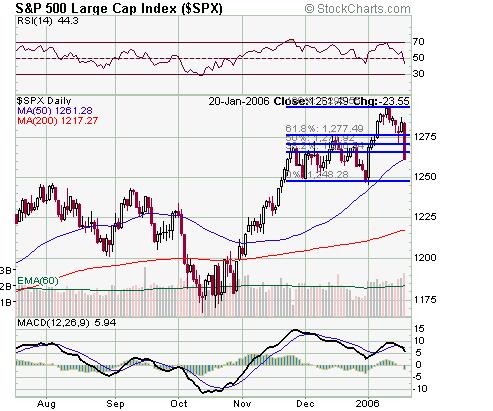
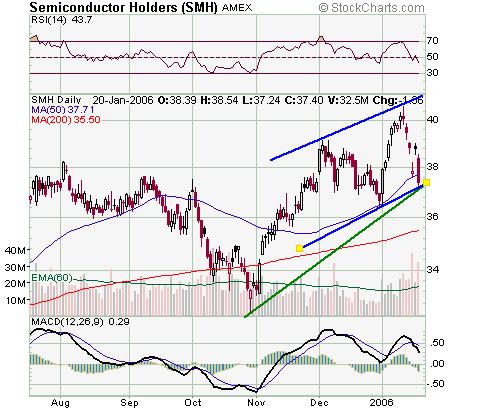
First the nice ones. SPX and QQQQ violated their Fibonacci retracement levels but are close to their 50 day moving averages and the upward trendline is still intact. SMH violated its 50 DMA but is still in its upwards slopinh channel.

Technorati Tags : Marketz Volatility technical-analysis SPX QQQQ SMH trendlines Stock-Market Trends
Saturday, January 21, 2006
Stockz & Marketz : Ominous action in GOOG
I notice that the recent bipolar behavior of the market has confused even some old market hands.
The market goes on to make new highs preserving all upwards trend lines and then registers its biggest one day drop since 2003 (I'm talking nasdaq here). The volume during its recent run-up was good but then the volume on friday was heavier. To almanac readers, the first five up days of January portends a good year for the market but then volatility is also increasing from historic lows. Earnings of bellwethers have disappointed but then all the excess M3 created by the fed has few other places to go to (certainly not real-estate anymore-If anything, money is coming out of real-estate). Oil and Gold are mighty strong but then Treasuries are unfazed too.
All these mixed signals are of little help in our relentless quest to fathom short-term and intermediate-term market trends and thus time the market. Anyplace then, where the signals are unambiguous ?
I think I might have one here. One word : Google. As THE LEADING STOCK OF THIS LATE CYCLICAL BULL MARKET, it is a reliable proxy for market sentiment. What can lead the market higher can also drag it lower, as we saw Friday.
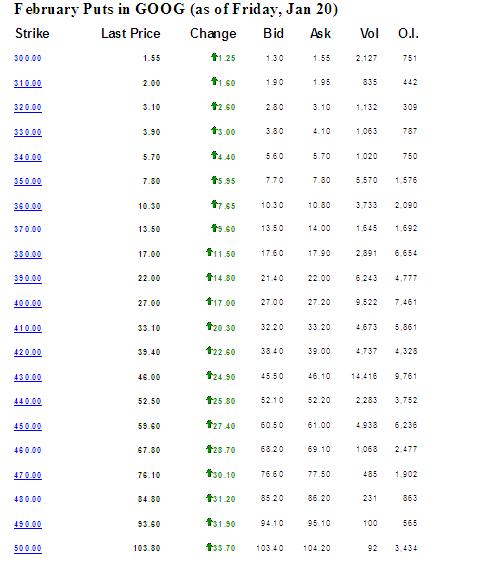
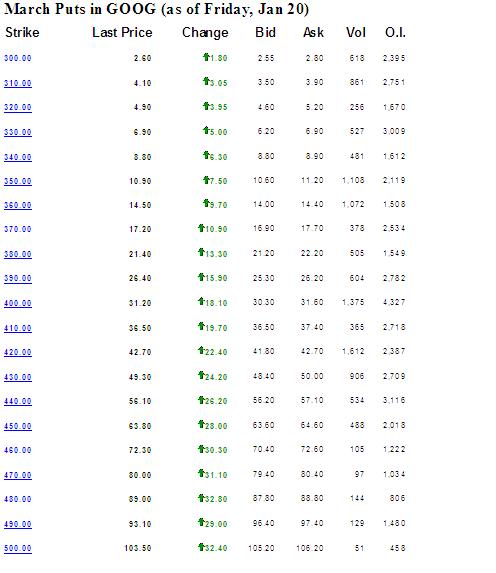
We know institutions have chased this stock higher. We know retail loves it too. Here is what I find most ominous about GOOG. The corresponding open interest in the near months is piddling to say the least. And I checked out every month including Jan'07 and Jan'08 LEAPS. Not many outstanding puts anywhere.
The absolute overall put interest across all strikes and months amounts to about 400,000. Friday saw a lot of puts-so that 400,000 number will increase but its still be around that figure. Also remember that a lot (in fact a majority) of these puts are in distant months and at strikes far away from the spot price of google stock (last trading at $399.46). Its only near-the-money, near month put open interest that provides short-term protection toe stock price. And those are conspicuously small for a high beta stock like GOOG. Considering the dramatic run-up in google's stock price from its IPO price of $85 to $475, I would have expected a lot more puts being purchased for protection. But that is not the case.
That tells me that a) Long-term holders have been too complacent and b) Lot of present stock holders are late-entrants to the party who felt no need to purchase put protection because they entered the stock at fairly high levels to begin with. Short interest ? The Jan run-up eviscerated the shorts.
GOOG has 296 million shares outstanding. About a 100 million of them are owned by insiders. About 150 million were owned by institutions (I say were, because Fri's 40 million volume may have changed things somewhat). And Henry Blodgett's blog has been talking about the fundamentals relating to google's stock price-love the spirited discussion on that site.
The point is : I think all sane holders of goog stock will either try to lock in atleast a portion of their profits or buy more put protection. And shorts are going to start piling up. All this will put further pressure on the stock price. It will not if the number of new buyers is so great that it compensates for the above pressure. But given developments on the GOOG-Govt front and upcoming earnings on Jan 31 , prospective new buyers are probably going to adopt a wait-and watch stance. And as GOOG goes, so goes the market.
Technorati Tags : Stockz Marketz speculation GOOG puts market-leader market-direction
Marketz & Strategies : QQQQ Jan to Feb options roll-over
QQQQs and SPX closed very close to the maximum pain points pointed out earlier. So to ignore options analysis is to do so at one's own peril. (more on the interpretation on max-pain curves later).
On the other hand, I also see a rush to blame the whole market decline on volatility related to options expiration. I mean, that was some serious distribution we saw there. Markets were down big on very heavy volume. QQQQ volume of 189 million shares (not including after-hours) was more than double average volume (~90 million shares). SMH (~32 million shares Friday) was also double average volume (~16 million shares). NYSE approached 3 billion shares in trading volume.
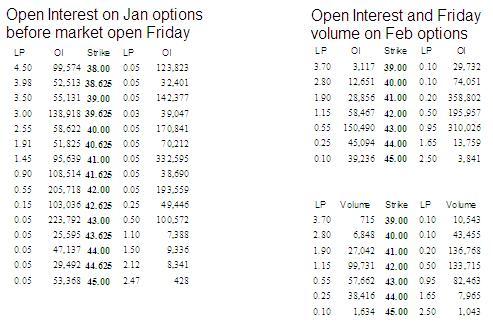
Feb open interest as a result of Friday transactions will be known only Monday after market open. But some guesses can be made by looking at the volume. Lets do some crude math here. Assuming all calls and puts on Friday were initiated on the buy side (somewhat unlikely-but great simplifier) and not taking into acount the same options being bought and sold again, we saw a lot more puts than calls. Now options close to the money are delta-hedged by market makers by buying/selling an offsetting position in the common.
So, restricting this analysis to the 41 and 42 strikes (most likely to be delta-hedged), there turn out to be 140,000 more puts than calls. Thats 14 million shares. Nowhere close to accounting for the 100 million extra shares.
Lets turn some of those assumptions on their head. Suppose, every one of those calls were due to premium selling and all the puts were due to premium buying, then even that unlikely scenario would account for about 40 million shares. Of course, there also options on the NDX that affect the QQQQs which I have neglected.
Bottomline : Options related activity may have contributed to the market decline but very unlikely to be the whole explanation. We did see distribution. The good news for active traders is that the heavy options interest in the Feb series is likely to result in market volatility remaining elevated for a while.
Technorati Tags : Strategies Marketz options-analysis trends roll-over volatility VXN QQQQ SMH
Friday, January 20, 2006
Intraday : Support Levels
SPX : 1270
OEX : 580
Those are the maximum pain points for today's expiration. i.e. the closing price at which the largest number of options expire worthless.
Other levels :
Dow Jones Industrial Average has support at 10,700
SMH : 50DMA at 37.68 and 200 DMA at 35.52
Technorati Tags : Intraday support-levels SPX trends DJI OEX QQQQ SMH crash
Intraday & Marketz : More volatility
I wrote recently back that I thought the pullback was over. Well, I was wrong. But I did notice too much giddiness in the market that led me to close out my bull call spread-though in retrospect I was more lucky than smart.
Technorati Tags : Intraday Marketz pullback trends crash volatility VXN QQQQ SMH
Thursday, January 19, 2006
Intraday Alert : Closed out QQQQ bull-call spread
The market shot up. Very strong market momentum. The market is giddy just as Doug Kass said the other day on TV.
I took profits and will wait to see how GE's earnings shape out. Hope to back with charts, etc in the evening.
Technorati Tags : Intraday Marketz pullback trends bull call spreads volatility VXN QQQQ
Marketz and Intraday : Pullback appears to be over
The recent pullback is almost over. SMH bounced nicely from its 50 DMA.
What next ?
A] Either the uptrend will resume in right earnest or
B] We will drift around in a trading range between 42 and 43.
I think Bull-Call spreads are the way to play this. If the market shoots up quickly, you take your profits and run. If it stagnates,you benefit from the absolute difference between the higher time premium between your out-of-the-money/at-the-money calls and smaller time premium on your well-in-the-money (but not too deep) calls.
The nasdaq volatility index (VXN) is sinking. I view that as confirmation for the rally and continue to watch it very closely.
What can upset the applecart ? GE's earnings, which are going to be out tomorrow. GE, simply because of its heft has to power to affect sentiment. So, ideally, time to get long is when GE's earnings are outta the way. But by then, it may be too late to join the party. Thats where balancing risk vs. reward omes in.
DISCLOSURE : Long QQQQ 40/43 bull call spreads
Technorati Tags : Intraday Marketz pullback trends bull call spreads volatility VXN QQQQ SMH
Wednesday, January 18, 2006
Stockz : Whats up with GOOG and SUNW ?
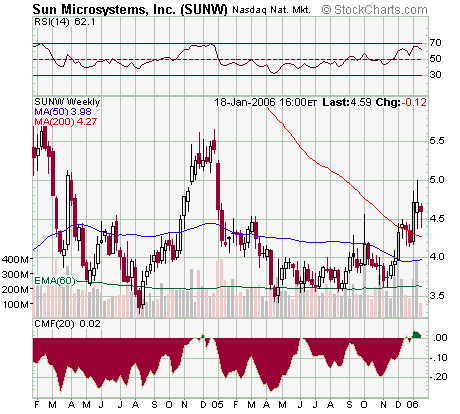
Is SUN Microsystems a take-over target for Google ? Richard Rhodes thinks so. It would be a pretty good way for GOOG to leverage its inflated stock-price dont ya think ?
My bias is technical. And I like the fact that the Chaikin Money Flow into SUNW has turned positive after a long long time. But now, I'm gonna step out of my comfort zone and look at the fundamentals here [like an investment banker would-yeah,right;-)]. So bear with me.
1. This c/net article looks at the escalating power consumption of server farms and SUN's solution to the same. Google, as one of the most server farm dependent companies and Sun, as the designer of the power efficient Ultrasparc T1 processors for servers, have some synergistic possibilities.
2. While its true that Sun's glory faded with the bursting of the dot com bubble, the company still has a cadre of really great programmers and engineers. They were the guys who came up with Java for chrissakes. Despite the fact that Sun in particular has experienced a lot of brain-drain, Sun programmers still command a lot of credibility on the software street. This other c/net article shows how easy it would be for SUNW and GOOG o get along even on a rank and file level.
3. Will the synergy kill Mr.Softee ?
4. Caveat emptor : SUNW has been mentioned as a possible take-over target for years - but nothing happened.
DISCLOSURE : I do not own positions of any kind in either SUNW or GOOG as of writing this post.
Technorati Tags : Stockz takeover speculation GOOG SUNW MSFT synergy
Marketz : VIX options coming .. very soon
Technorati Tags : VIX options
Intraday : Moving average checks
SMH at 37.87 is very close to its 50-day simple moving average at 37.61. QQQQ (last trading at 42.18) has its 50 DMA at 41.53.
If the uptrend YTD is real, the 5) DMA would be the logical springboard for a bounce. Hence, worth keeping an eye on.
Technorati Tags : Intraday SMH QQQQ Moving Average Market Direction Trends
Intraday and Sectorz : Gold stocks were due..
This blog has been documenting the recent turbulence in "momo" sectors. In this previous post, we hypothesized that gold stocks would see a correction sooner rather than later as a rolling pullback commenced late last week in all momentum driven stocks and sectors. We saw airlines taken down, semis whacked, internets drubbed and Japan smashed (JOF down close to 5 %). Only gold stood tall awaiting its turn.
Today, the metal itself is down close to 2 % while the Philadelphia Gold & Silver Index (XAU) is down more than 3%. Blue Chip gold stock Newmont Mining (NEM) is down a couple of percent after being down yesterday as well. Right now, the pullback has been of the relatively mild variety. After all, the fundamentals in favor of gold (Iran, Nigeria, Printing presses, Crude/gold ratio, etc.) are still intact.
Technorati Tags : Sectorz Intraday XAU Gold momo NEM
Sectorz : Japan


In this previous post about sectors/ETFs/stocks dominated by momentum players, Japn was also mentioned. The Japanese market has suffered declines of close to 5 % in just two trading days. I think EWJ(ishares Japan) and JOF are great ways to make Japan plays.
EWJ close to its 50 DMA may make a great entry point for a long position. And JOF (Japan smaller capitalization) is making a symmetrical triangle but may break downwards after tonight's asia action.
Technorati Tags : Sectorz JOF momo trends EWJ symmetrical triangle
Savage Attack of Hackers on my Blog
Listen up everybody. My google blog account was hacked into. The intruder posted nonsense rhymes about Philly Jazz. Several posts had been deleted. Thankfully, I had also saved them elsewhere. I regained control of my blog and changed my password, but I'm not sure this will be sufficient to deter the as******.
It almost seems like sabotage to me. I mean my blog has been up less than a month and my sitemeter tab shows this blog getting -lets just say a lot of visitors- for such a young blog. Maybe somebody's not happy about that. I am a little paranoid to begin with and then this happens. Maybe its just a wicked adolescent hacker who found out how weak my password was and broke in just for fun to play a prank on me. Or it could be something more sinister. I am taking no chances. Who knows ? Perhaps, my userid and passwords I type in various forms are being monitored by a remote computer. Gotta change all those brokerage account ids & passwords. From a different terminal.
So, please-if any of my readers have any knowledge of similar problems at other blogs/websites and know what to do to combat this uncouth behavior, let me know either via comments on the blog or by emailing me directly at kaiser.soze@execs.com
Tuesday, January 17, 2006
Intraday & Stockz : What happened to Intel ?
Here's a street.com article on the minutiae of intel's earnings announcement. And another news item on c/net to get a slightly different perspective from that of the news & wire services.
And to think stock seasonality indicates January to be the best month for Intel shares ! And Bill Fleckenstein's relentless bearishness on Intel vindicated (at last !)
From this bloomberg.com news item, "We think the market in general is OK. We had a little bit of (market) share loss. There was a little bit of weakness in consumption of the desktop PC.'' - Intel CFO Andy Bryant.
Technorati Tags : Intraday Stockz INTC
Intraday : The momos have spoken
In afterhours, we're seeing a panic-laden rush to the exits out of tech stocks. Big moves in the bellwethers. YHOO down 13 %, INTC down 9%.
The Semis (SMH) are down close to 4 and a half percent just today, including AH action. SEMIs have now given up close to two-thirds of their year-to-date gains.
Market pricing of actions indicated nothing of the turmoil we have witnessed on the first day of the week. Savvy traders faded the market bias in options pricing. VXN close to 17. Another to keep an eye on.
Technorati Tags : Intraday INTC momo trends YHOO volatility
Sectorz and Intraday : Watch the momos
We talked about momo sectors being taken down one by one in this post. Precious metals stocks have run up a lot and as one of the few momo sectors not taken down yet, they are vulnerable to a sharp pullback. Even if that pullback is healthy correction in an upward trending market that sets the stage for the next leg up. Is it going to begin today ? Newmont is down close to 1 % Pre-Open.
All in all, should be a very interesting session.
Technorati Tags : Sectorz Intraday XAU Gold momo RSI
Stockz & Strategies : Shape of Max-Pain Curves
Here's the latest maximum-pain options analysis courtesy of BCA software. I want to talk about the importance of the shape and curvature of the pain-curves and I need the graphs for illustration. But that stuff is all proprietary to ez-pnf - so I cant reproduce them here.
Take a look at the graph for Applied Materials (AMAT) Feb options. Even if AMAT swings wildly from 15 to 23, the value of the options change by a mere 20 million dollars which is chump change considering the market cap of AMAT.
Now look at the graph for Apple (AAPL) Feb options. For similar percentage swings in the stock price, the value of the options change by several hundred million dollars. Recall that the Max-Pain analysis calculates the closing stock price that results in the most number of options expiring worthless. Over here, options analysis is more relevant due to the larger pinning effect.
Technorati Tags : Strategies Volatility Options Analysis momo Stockz ETFs Market Direction Trends
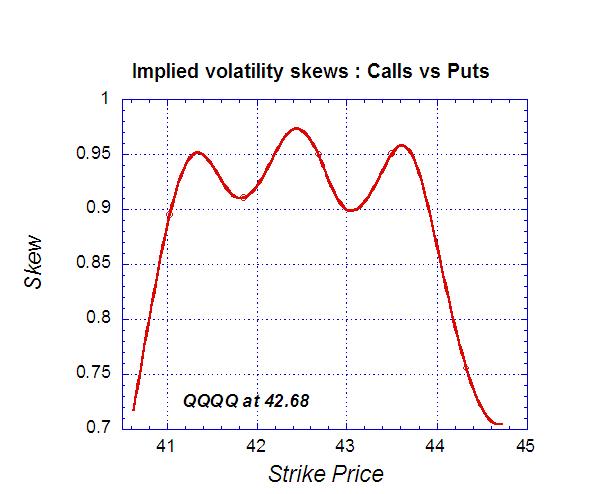
Marketz : Implied Volatility Skews in the QQQQs

More information on the skews can be found in earlier posts. Its expiration week and out of the money options are cheaper than in the money options. Option pricing is biased towards a range bound market. At the money calls are slightly more expensive than puts-a slight upward bias. As this blog has pointed out, in the last several weeks, market bias in options pricing has been faded more often than not. Lets see what happens expiration week.
Technorati Tags : Marketz Volatility Skews Options Analysis QQQQs Calls Puts Market Direction Trends
Saturday, January 14, 2006
Marketz : Options Arcana
Courtesy of the daily options report , I learn that the market put in a green VIX/green S&P combo. This post explains the significance.
Technorati Tags : Marketz Volatility Strategies Options VIX Market Anecdote Market Direction Trends
Friday, January 13, 2006
Marketz & Strategies : Rolling pullback in store ?
When the markets were rallying the last seven consecutive days before Thursday and looked unstoppable, Dave Landry at Trading Markets pointed out that markets will sometimes stage a rolling pullback. This is one where the market doesnt drop all at once, but specific leading stocks and strong sectors will pull back one at a time. Sometimes even one day at a time.
I was intrigued by the idea. Its still too early to say (because the broader market has been rallying till Thursday)-but still, lets examine the possibility.
Firstly, what are the sectors/stocks/ETFs with the most "mo" recently ? And I mean real mo. That should be easy.
Hot Sectorz/ETFs
1) Oil services : OIH (started decline Thu, Jan 12)
2) Precious metals : XAU & HUI (still rising)
3) Semiconductors : SMH (Doji on Jan 12, significant decline Fri, Jan 13)
4) Biotechs : IBB (Doji on Jan 10, decline on Jan 11)
5) Airlines : XAL (Doji on Jan 9, decline began in earnest Jan 10, now looks very bearish)
7) Internet : HHH (decline began Jan 9)
8) Japan small cap : JOF (consolidating)
9) Networkers : NWX (decline on Jan 12)
Hot Stockz - ~10-20% YTD return (golly !)
1. AAPL : consolidating
2. SNDK : they took it down Jan 13
3. GOOG : took it down Jan 12
4. NEM : continues to rise
5. TIE : decline began Jan 9
6. ELN : doji on Jan 13
7. BRCM & MRVL : took it on the chin Jan 12
I'm sure I've left out a couple of names, but you get my drift. If there is anything at all to this rolling pullback idea, may we look forward to a decline in gold related names next ? After all, only gold remains untouched among the momo sectorsand it is rather stretched. Thats why Newmont's standing tall too. Now, I know there's all that geopolitical stuff with Iran supporting gold. I dont care. Russia's pipeline scare last week neither hurt stocks nor helped natural gas. Listen only to prices. I'll be waiting and watching.
Technorati Tags : Marketz Volatility Strategies momo Stockz ETFs rolling pulback Market Direction Trends
Strategies and Marketz : I luv Momos Part I
It really pays to know who your fellow investors are ; especially when you are invested in that stock/sector. Are they deep value guys who are going to patiently stick around for a long while or are they of the day-trading variety ?
As an active trader and as somebody who loves using options to amplify leverage, I want to be in sectors/stocks/ETFs where sharp short term moves occur and yet, where some underlying trends persist, thus allowing for a coherent basis to speculation.
That means the stocks that very so gently rise a percent or two a month with no sharp moves are not the ones I would trade speculatively. But it also means I hate the NMGCs and TASRs of the world. Sure, these stocks have plenty of sharp short-term moves but their occurrence is too chaotic for me. Those stocks and the many other stocks like them (and some ETFs too) belong in the realm of the super-day-traders.
The sweet spot for me is to identify sectors where
i) Clear trends are evident
ii) Volatility is high
iii) Liquidity is high
iv) Transaction volume (in terms of dollars and shares) is high
Basically, I'm looking for sectors/stocks/ETFs where momentum chasing funds have a huge position.
The market may not be a zero sum game, but it is not too far from it either. Stealing from other short-term traders is a futile exercise for a small or medium sized speculator. The only way (IMHO) to consistently make money is to siphon off cash from an arena where the Big Boyz play. Where the daily churn is in the hundreds of millions of dollars if not billions, so that a few thousand dollars is a mere rounding error. That is also the arena where a small speculator can play to his strengths. An what are these strengths exactly ?
AGILITY AGILITY AGILITY
and of course, the FLEXIBILITY that comes with that agility.
Think about it. When a big player (say a momo fund) that has a short-term focus enters a stock, they simply cannot allow the market to come to them as they accumulate and build up their positions. If they waited for ever for the right prices for each new block-buy, the trend maybe over before they even have a position. They have to accumulate quickly and their very desperation creates short term trends that translate into tradable moves. And they may have to distribute quickly too. Because of their short term focus, they need to take profits every now and then. And despite their short term focus, their size places grave limitations on how quickly they can enter and exit.
There is a fundamental asymmetry here and one that I have profited from and hope to continue to profit from.
This is not a weekend lecture-fest. There is a point to my philosophizing. And that is those stocks/sectors/ETFs where the big momo funds have a huge presence are the best places to make money for small speculators with a short-term bias. To be continued ...
Technorati Tags : Strategies Marketz momo trends trading philosophy volatility
Marketz : QQQQ at 43
Just before market open, implied volatility picture in the January series : Calls more expensive than puts.
Strike Call IV Put IV
42.525 16.3 14.4
43 15 12.3
43.625 14.3 12.1
Open Interest at the 43 calls dropped 150,000 to about 250,000 on higher volatility.
Technorati Tags : Marketz Volatility Skews Options Analysis QQQQs Calls Puts Market Direction Trends
Thursday, January 12, 2006
Marketz & Sectorz : The Greenback

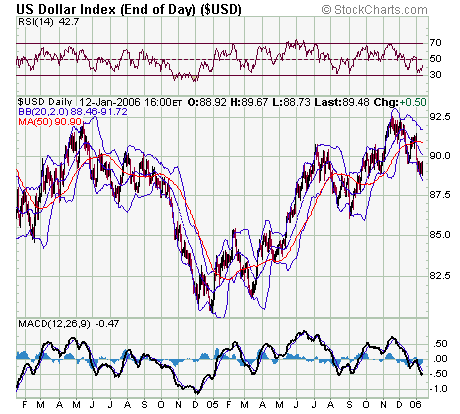
RSI turning up from modestly oversold levels, price coming off the lower bollinger band and a bullish engulfing pattern to boot !
Technorati Tags : Sectorz Marketz Bollinger bands candlestick patterns USD
Marketz Intraday : Phew ! what a day
Did you see the sharp intraday reversal on the semis ? How about the sharp rally in the greenback. And gold barely flinches ? Too much going on. Gotta watch the tape especially in this last half-hour. Will be back later with more...
Technorati Tags : Marketz Volatility VIX Intraday Market Direction Trends
Marketz and Sectorz : Volatility ahead in the gold stocks ?
There is a Bollinger Band constriction in the 15 day chart of the Philly Gold & Silver Index (XAU). Price action in the last four days has consisted of four small candles, two white and two black. However, the volume on the black candles has been larger than the volume on the whites. RSI is neutral on the 15-day chart but overbought on the 6 month chart.
Technorati Tags : Sectorz Marketz XAU Gold Bollinger bands RSI
Wednesday, January 11, 2006
Marketz : Volatility predictions
- The punditocracy thinks volatility is headed higher.
Technorati Tags : Marketz Volatility VIX Options Analysis Market Direction Trends
Tuesday, January 10, 2006
Marketz : Where do we go now ?
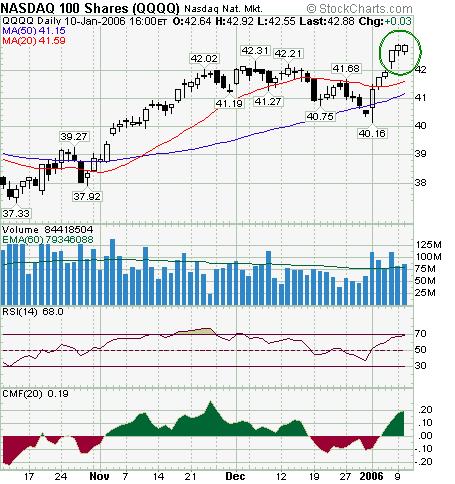
QQQQs made an interesting candlestick pattern today called side-by-side white candles. According to my 1990 edition of Seiki Shimizu's "The Japanese Chart of Charts", there are three kinds of side-by-side whites :
a) upside gap side-by-side whites
b) downside gap side-by-side whites
c) side-by-side whites in stalemate
There is no intervening gap, so a) and b) can be safely ruled out. On to c) :
To be conclusively identified as c) , a long upper shadow on the yesterday's candle would have been helpful. But we dont have that help.
I quote the master : On a rising market, when this type of "side-by-side whites" appears, we can tell that the market has come close to its limit and is lacking the support needed to move any higher. Buyers up to this point have exhausted all their energies and even though a new high price is set with a large volume, an "upper shadow" is formed. Naturally, on the following day, we see an inevitable low starting price, however, with more defensive buying and short covering, we see another white line formed which is where we get the name "side-by-side whites in stalemate"
Lets dig deeper. here's a 1 month chart of the TRIN. The absolute value of the TRIN is close to 1, which suggests an equilibration of buying and selling pressure or a stalemate. However, the trend of the last few days is UP (in otherwords from buying to selling) and the 10 day simple moving average is turning up.
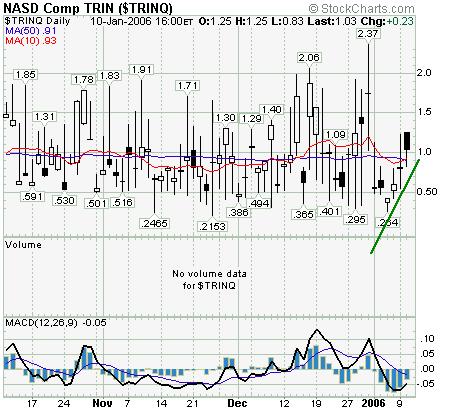
Its still too dangerous to challenge a tape as strong as this and shorts are outta the question. But it maybe a good time to take profits (I did-liquidating my long QQQQ 39 calls and long SMH 37.50 calls at the end of the session). Consolidation and range-bound action in the near term is more likely. Even if a strong pullback is going to manifest itself, I suspect a more authoritative reversal signal such as a DOJI will appear first.
Technorati Tags : Marketz TRIN Candlestick charts SMH QQQQs Calls Puts Market Direction Trends
Intraday : QQQQ 43 is the new Rubicon
43 still not breached. As of 3 pm EST, 396,000 calls and 44,000 puts at the 43 strike. Two attempts to reach 43 have been foiled. Once yesterday at about 2 pm and once today around 1:30 pm.
Technorati Tags : Marketz Volatility Intraday Options Analysis QQQQs Calls Puts Market Direction Trends
Monday, January 09, 2006
Marketz : Today's trading action
Today about 100,000 of these calls were liquidated as open interest dropped to ~400,000. So you would think there's less resistance right ? Not so fast. Nasdaq implied volatility (VXN) increased 4.75 % today. Now VXN is calculated from a bunch of options but the greatest weightage is given to at the money (ATM) options of the month at hand. At some level, implied volatility is a measure of buying pressure vs selling pressure on options (both calls and puts).[ In fact, a lot of people think excessive option writing is responsible for the slow and steady decline in implied volatility, which is at historic lows across all indices] So my best guess is that buying pressure was higher than seeling pressure. Thats normal 'cause people maybe buying puts to lock in their recent gains. But back to the 100,000 calls that were liquidated-I think that was people who wrote those options were buying them back..so as to not to miss out on further upside. If I'm right, thats excessively bullish sentiment.
Till as late as 3:45 pm, the total volume of shares traded on the QQQQs was hovering aroung 66 million shares (if my memory serves me right). There was a volume surge at the close of more than 10 million shares. Considering that the QQQQs dipped after the close, that might be a little late in the day distribution right there ?
What about technicals ? Monthly and Trimonthly RSIs are just hitting 70-not yet in nosebleed territory. But Bollinger bands getting constricted again in the Biweekly and Monthly charts and of late, Bollinger Bands where the actions been. That said, market action on Monday defines the weekly trend (usually, but not always). If the QQQQ breaks 43 and stays there, that will be mighty impressive.
Technorati Tags : Marketz Volatility Intraday Options Analysis QQQQs Calls Puts Market Direction Trends
Intraday : Pullback on Bollinger Band Expansion
Charts courtesy of Prophet and OptionsXpress
On Monday just after 2:20 pm, we witnessed another textbook expansion in volatility in the QQQQs after the 20 period, 2-SD Bollinger bandwidth had constricted in the daily chart. The QQQQs and other indices pulled back from their session highs but volume did not confirm. So, we are seeing a rally from the lower bollinger band. Where the indices close today and on what final volume will be KEY.
Technorati Tags : Intraday
Saturday, January 07, 2006
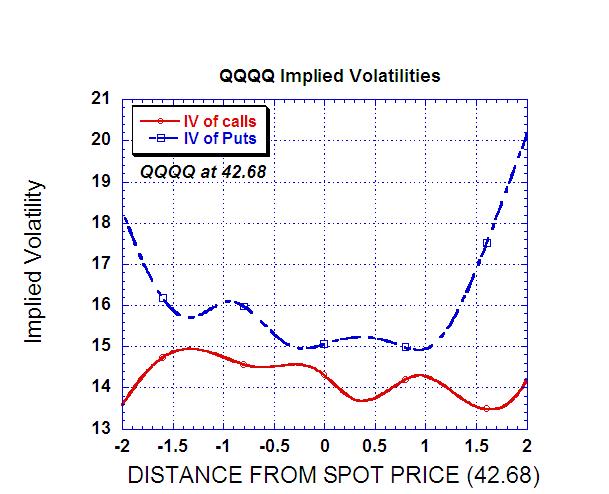
Marketz : Implied Volatility Skews in the QQQQs
More information on the skews and their interpretation can be found in this earlier post.
What we see now in the QQQQs (at 42.68 as of 01/06/2006) is that at equidistant strikes, the implied volatility of puts is uniformly larger than the IV of calls. In the event of there being no market bias, the skew is 1.0 since calls and puts at equidistant strikes cost the same. Now, the skew close to the spot price is between 0.9 and 0.95. The market is pricing in a small but significant bias that stock prices are headed lower.Does that mean the market will go lower ? Not necessarily. Traders can fade this bias by buying the cheaper options(the calls) and selling the more expensive ones (the puts).
Over the last few weeks, this bias has been faded. On Dec 19th, calls were more expensive than puts. The ensuing week saw a decline in the QQQQs. Last week, puts were more expensive than calls- QQQQs rallied impressively.
Therefore, considering the trend of the past few weeks, I think the volatility pricing is slightly bullish.
Technorati Tags : Marketz Volatility Skews Options Analysis QQQQs Calls Puts Market Direction Trends
Marketz : 'Macro Picture'
As of Friday evening 10:12 pm, PST
Gold 100 Oz Futures (Feb delivery) at $ 540.8
Crude Oil Fut at 64.21
1 Euro : 1 USD = 1.2151
10 Yr T-Bond Yield at 4.379 %
Technorati Tags : Sectors Marketz Crude Oil Gold 10 Year Note Euro
Marketz : Jan'06 Expiry Analysis
QQQQ closes at $41
SPX closes at 1260
Friday, January 06, 2006
Sectorz : Ka-Ching in Senior Loan ETFs
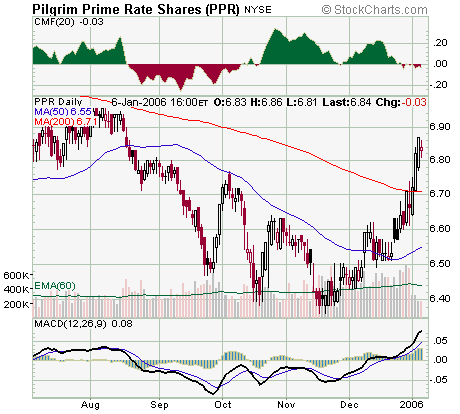
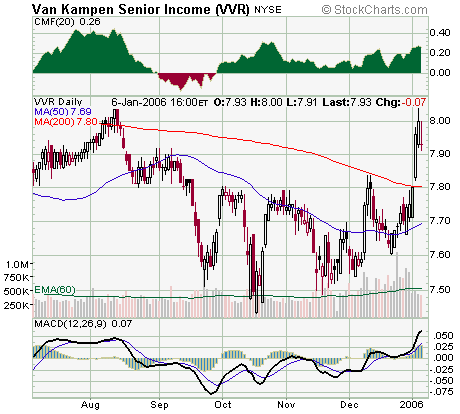
About a week back, I analyzed price action in the senior loan sector (also known as floating rate funds) that led me to sniff out a bottom. On reason I have been watching the sector is that most funds in this sector sport dividends in excess of 7 % in . So, if a bottom has been made, there is the prospect of capital gains and huge dividends-in other words a bonanza. Like REITs in 2003 and 2004.
Yeah, I know. You're saying common Kaiser, how does this week's action tell us anything ? This was a good week for almost every stock and asset class with few exceptions. I saw a lot of pigs flying on Friday.
But most of these funds have been up 5 % in about two weeks of trading. Thats something to take note of. And the rally in the senior loan ETFs started in late Dec itself. They seemed to sense the contents of the Fed minutes. This sector loved 2003, the year of reflation. Is 2006 going to be like 2003 ? (I plan to delve deeper into this theme in a later post)
(Above) The 6 month charts of PPR and VVR show them both comfortably breaching the 200 DMA. Run up has been too quick, so pullback maybe in order. RSI is overbought and Money Flows seem to be moderating.
[Disclosure : Long PPR at 6.49]
Technorati Tags : Sectorz Floating Rate ETFs PPR VVR Reflation Dividends
Wednesday, January 04, 2006
Marketz & Sectorz & Strategies : Why is Pharma rallying ?
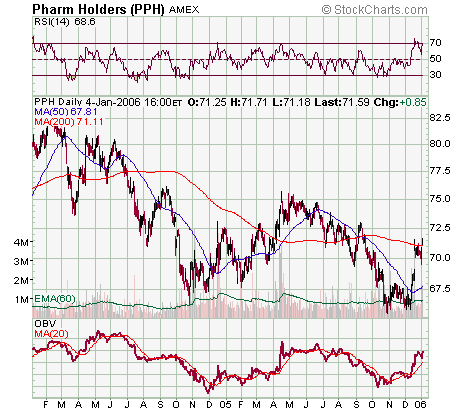
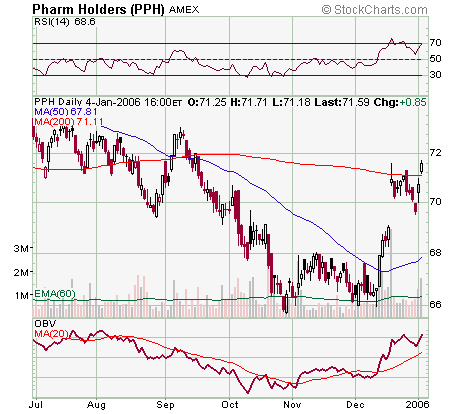
Pharmaceuticals continued to rally today spectacularly overcoming the 200 DMA on nearly twice average volume. This move in PPH is BIG.
As the 2 year and 6 month charts show, big cap pharma has been in a severe bear market for the last two years and the bounce might merely be a rally from oversold conditions.
However, I am not inclined to think so. Heavy volume has accompanied this upward move in the pharmas which started in late Dec when the broader indices tripped a little bit. The impressive On Balance Volume seen in the charts clearly indicates hevay money flows into this sector.
It makes me wonder if the smart money knows about the impending slowdown and is already moving into defensive sectors.
Coming to think of it, some of the other defensive sectors dont look that defensive anymore. Defense has enjoyed the benfits of war-spending for nearly three years now and defense spending seems to have either plateaued or in the process of plateauing. Utilities have enjoyed a huge rally all year and look ripe for a correction.
That leaves Consumer Staples. XLP bears close watching.
Technorati Tags : Sectorz >Marketz Strategies
Marketz : Jan'06 Expiry Analysis
QQQQ closes at $41
SPX closes at 1260
Technorati Tags : Marketz Options
Marketz : What about the Skews ?
Lets review to see if I had anything useful to say.
"Both the QQQQs and the SMH are sitting right at their 61.8% Fibonacci Retracement Levels. SMH is also at its 50 DMA. I dont expect the 34.43-34.61 gap on the SMH to be filled anytime soon-that is a remote possibility at this point. In the near term, I see one of two scenarios unfolding :
Scenario 1 : Bounce from these levels, implied volatility (VXN right at 50 DMA) slips and the uptrend that started in late Oct is intact.
Scenario 2 : RSI is not yet in oversold territory on either chart, so a further retracement to a lower level is possible. If the retracement is to the 50 % level, implied volatility will remain static or increase (but not spike). If the retracement occurs to the lower 39.2 % level, QQQQ gap (39.46-39.68) will be filled and expect implied voltaility to spike as fear sets in among sellers of the 35 puts on the SMH and 39 strike on the QQQQs.
Finally, note that the 50 day and 200 day moving averages for both ETFs are still sloping upwards."
Turned out Scenario 1 panned out in technicolor. Of course, we'll need a little more time to see if the uptrend is still intact. But today's high volume blockbuster rally is certainly encouraging.
As for the voltaility skews,
"What we see now in the QQQQs (at 40.41 as of 12/30/2005) is that at equidistant strikes, the implied volatility of puts is uniformly larger than the IV of calls. In the event of there being no market bias, the skew is 1.0 since calls and puts at equidistant strikes cost the same. Now, the skew close to the spot price is between 0.9 and 0.95. The market is pricing in a small but significant bias that stock prices are headed lower.
Does that mean the market will go lower ? Not necessarily. Traders can fade this bias by buying the cheaper options(the calls) and selling the more expensive ones (the puts).
In the recent past, I have noticed that market biases on highly liquid ETFs seem to be faded while the market biases in individual high beta stocks seem validated. "
Traders faded the market bias alright, as they have been doing recently on the ETFs.
What does all this portend for tomorrow ?
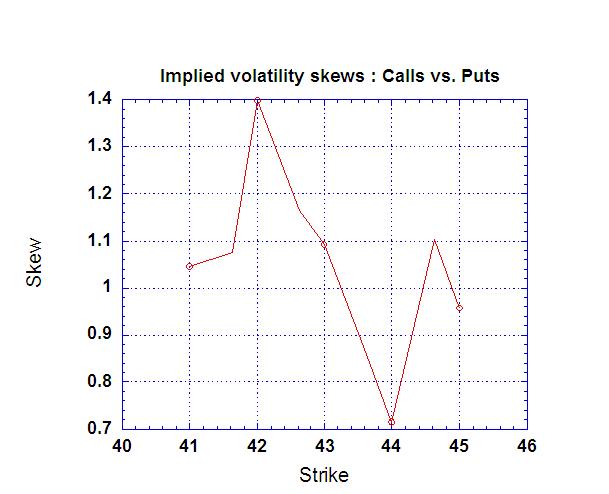
I have not had the time to run the spreadsheet program. Nevertheless, lets take a quick look at the skew of calls vs puts. QQQQ is at 41.30 so the 41.63 and 41 strikes are nearly equidistant from the spot price.
ITM 41 call has IV of 14.9 while ITM 41.625 put has an IV of 14.3 Skew = 1.04.
OTM 41.625 call has IV of 14.8 while OTM 41 put has an IV of 14.3 Skew =1.03
Close to the spot price, the market is almost neutral, ie bias although in favor of calls is very small.
Lets dig a little deeper now, for ITM strikes [1.3] distant from spot price, Skew = 1.22 and for OTM strikes [1.3] distant, skew= 0.90
Again, ITM calls diverging in price from in the money puts, but nothing spectacular. Remember that the skews grow larger as you go deeper in the money. Little market bias- basically neutral.
Technorati Tags : Marketz Volatility Skew Kurtosis
![]()