Sunday, January 22, 2006
Marketz & Sectorz : Some pretty ugly charts
When one looks underneath the surface of the market at the charts of the various sector ETFs, the extent of the technical damage becomes apparent. These charts are painting a fairly grim intermediate-term picture.
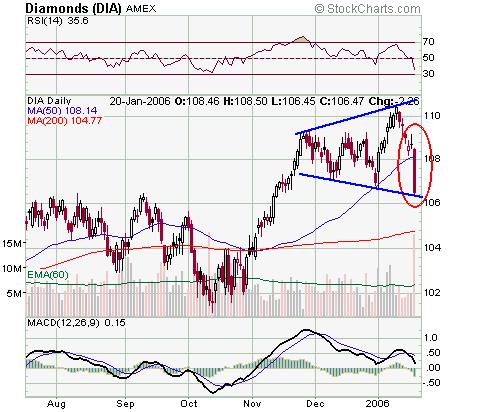
Firstly the DOW. Unambiguous bearish Megaphone with an evening doji star pattern to boot in the last three trading sessions.
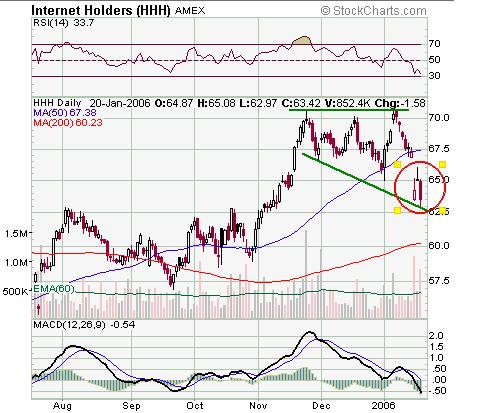
Bearish megaphone and an evening star (bearish) candlestick in the Internet Holders (HHH).
Bearish descending triangle in the retailers (RTH). Bearish evening doji star candlestick at the end.

Wedge pattern in the one year chart about to become megaphone in the industrials (XLI). Also bearish candlestick action in the last three trading sessions.

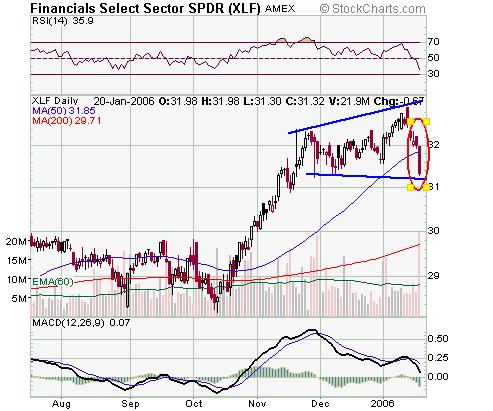
Bearish megaphone in the XLF after an uptrend signaling further downside. Confirmed bearish engulfing candlestick pattern in the financials.
Technorati Tags : Marketz Sectorz technical-analysis DIA HHH RTH XLF RTH XLI trendlines Stock-Market Trends evening-star candlesticks
![]()