Monday, January 02, 2006
Marketz : Implied Volatility Skews in the QQQQs
For those unfamiliar with options analysis, www.ivolatility.com is a great resource that explains skew and kurtosis in an easy and understandable fashion.
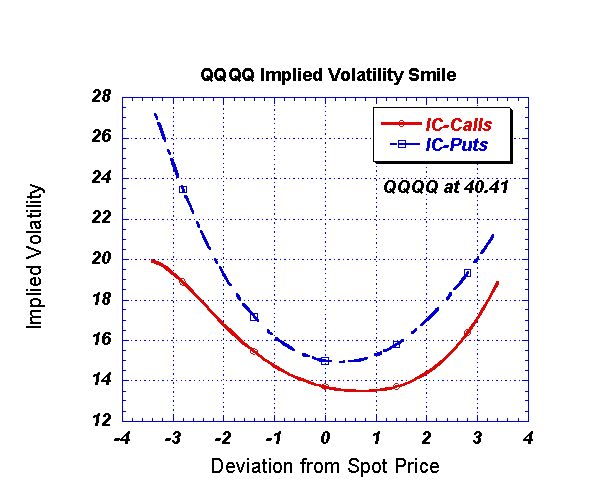
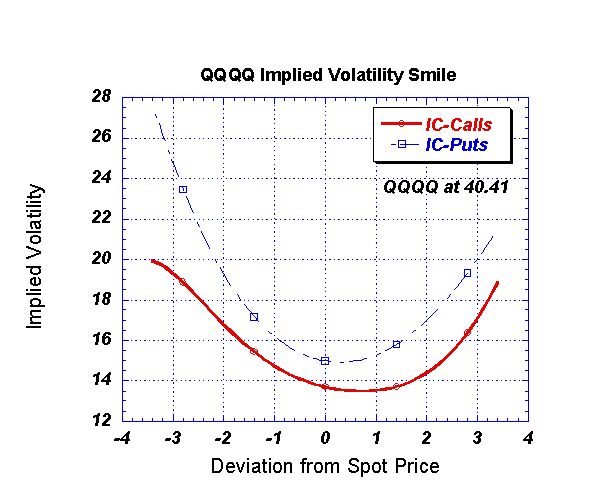
The volatility skew shown in these graphs represents the relative cost of buying calls and puts that are equally in the money (or out of the money). Suppose the QQQQ was at 40. The 37 call and 43 put are at equidistant strikes from the spot price-so they should cost the same, right ? But, they often don't because the market prices their implied volatilities quite differently. Skew is a measure of this price distortion and provides useful information about the relative value of options as well as prevailing market sentiment.
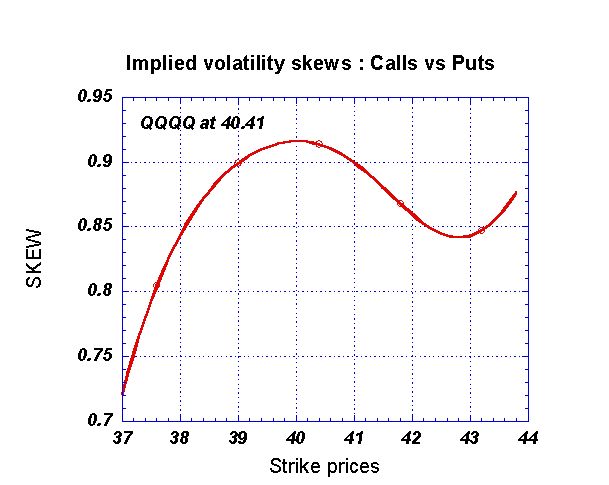
I calculated the implieds and the skews myself using a spreadsheet program I made. The raw data was downloaded from publicly available delayed options price quotes. Skew is calculated according to (Call IV/Put IV) at equidistant strikes.
What we see now in the QQQQs (at 40.41 as of 12/30/2005) is that at equidistant strikes, the implied volatility of puts is uniformly larger than the IV of calls. In the event of there being no market bias, the skew is 1.0 since calls and puts at equidistant strikes cost the same. Now, the skew close to the spot price is between 0.9 and 0.95. The market is pricing in a small but significant bias that stock prices are headed lower.
Does that mean the market will go lower ? Not necessarily. Traders can fade this bias by buying the cheaper options(the calls) and selling the more expensive ones (the puts).
In the recent past, I have noticed that market biases on highly liquid ETFs seem to be faded while the market biases in individual high beta stocks seem validated. Now, this is merely an opinion whose statistical basis is questionable. But I will tell you this : On Dec 19th, just before market open, on the eve of the decline of the last two weeks, the skew was greater than 1 across most strikes and the market bias was clearly towards upside movement. And traders faded it bigtime !
Technorati Tags : Marketz Volatility Skew Kurtosis
![]()