Thursday, January 12, 2006
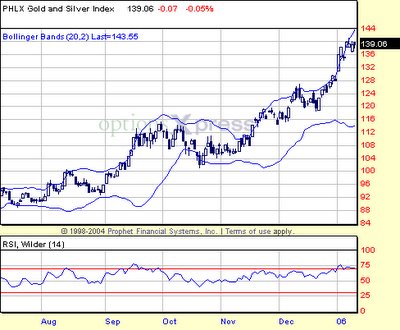
Marketz and Sectorz : Volatility ahead in the gold stocks ?


There is a Bollinger Band constriction in the 15 day chart of the Philly Gold & Silver Index (XAU). Price action in the last four days has consisted of four small candles, two white and two black. However, the volume on the black candles has been larger than the volume on the whites. RSI is neutral on the 15-day chart but overbought on the 6 month chart.
Technorati Tags : Sectorz Marketz XAU Gold Bollinger bands RSI